User Interface Areas
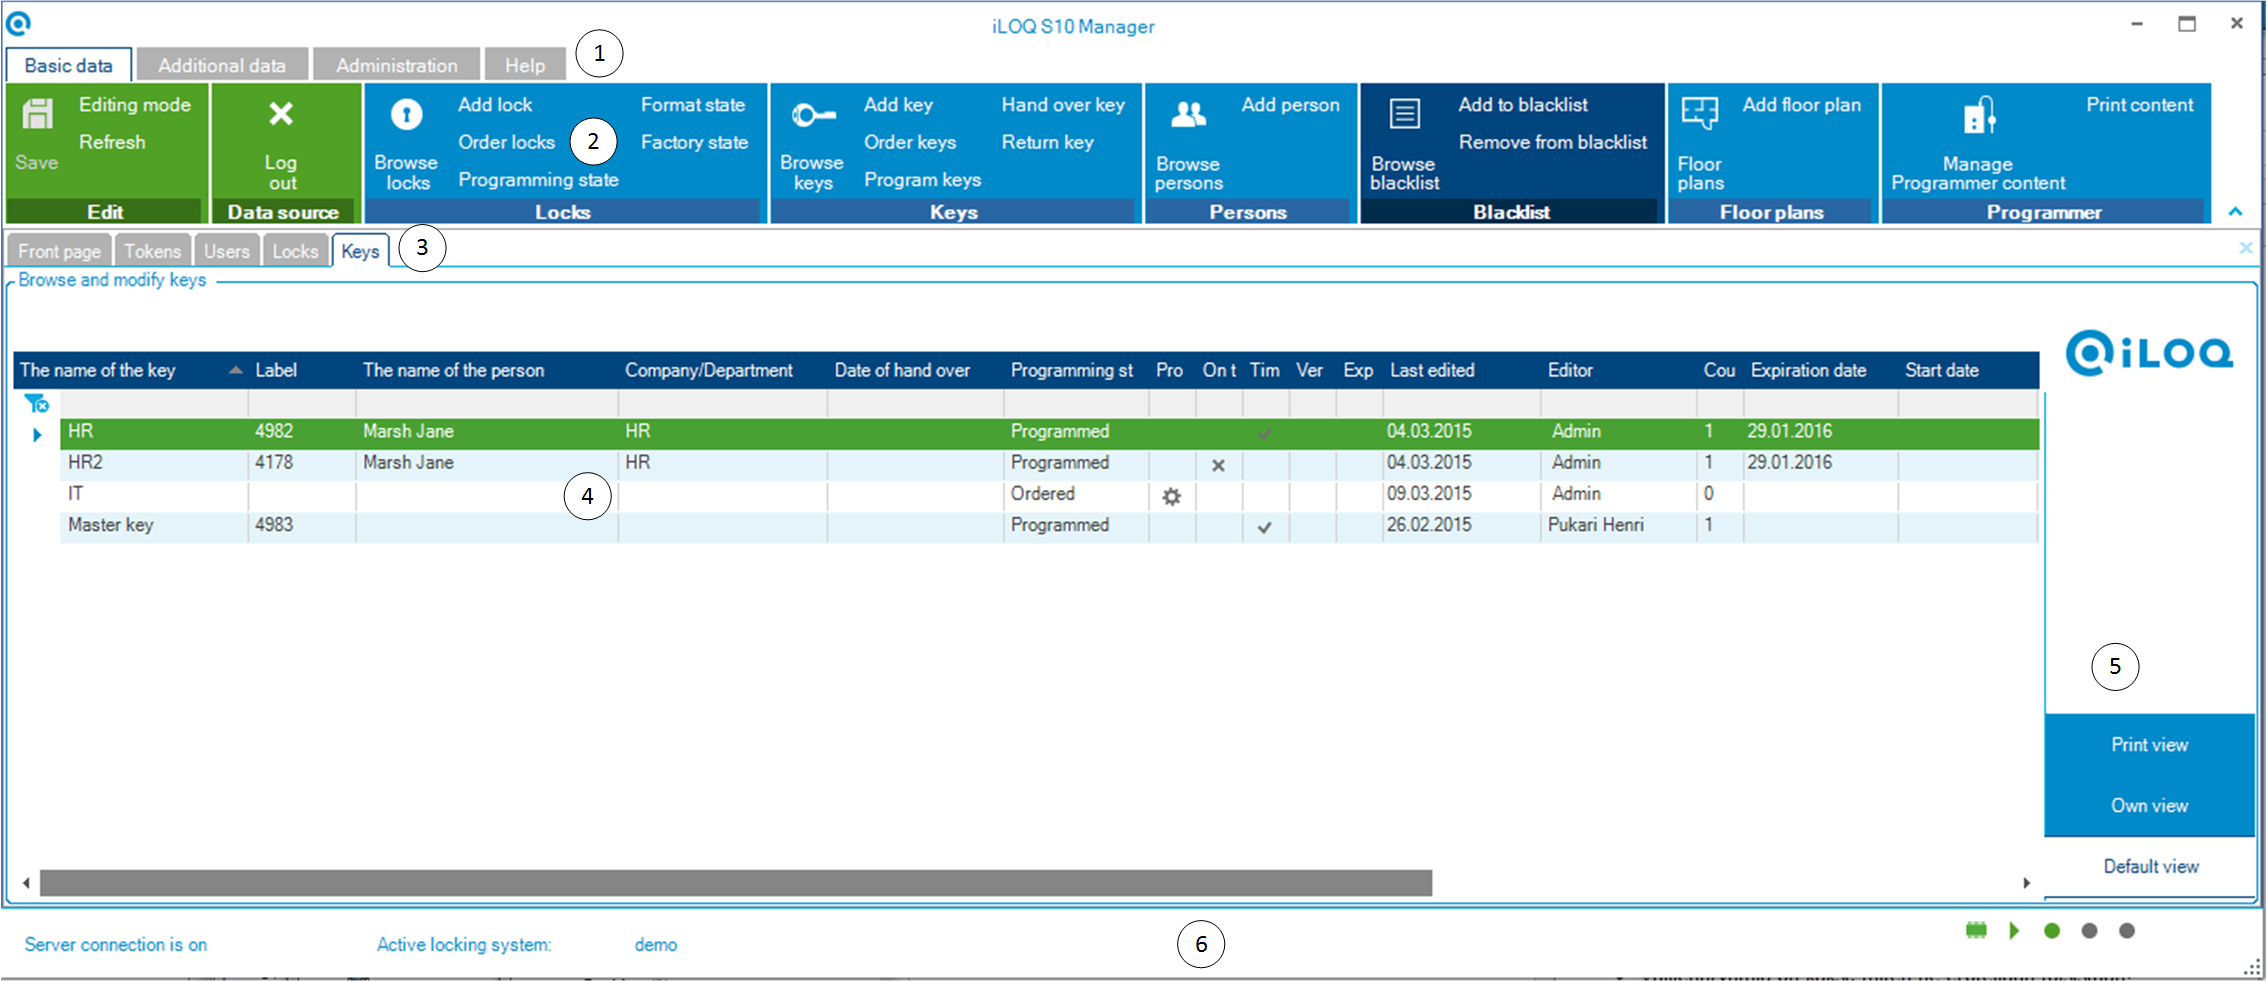
The iLOQ Manager user interface is depicted in the figure below.

The user interface areas are:
-
Main tabs — The user interface is divided into four main tabs:
- Basic data — The Basic data main tab is used to manage the most usual objects in the system, such as locks, keys and persons.
- Additional data — The Additional data main tab is used to manage access rights, person roles and reports in the system.
- Administration — The Administration main tab is used to carry out administrative tasks for the system.
- Help — The Help main tab contains the user manual and various information on the system.
You cannot close main tabs.
-
Ribbon — The Ribbon contains various tools for managing the system. Each Main tab has a different set of tools.
Tip:The button labels disappear if you resize the window and make it smaller. To see the label tool tips, place the cursor over the button.
-
Tabs — The Tabs show the pages you have recently opened, as tabs.
You can close tabs by selecting the tab and clicking the Close icon at the right-hand side of the tab bar.
-
Grid — The Grid shows a list of objects for the selected browsing view. If you have, for example, chosen , the Grid shows the list of tokens in the system.
-
Views — The Views area has three options:
- Default view — If you select the Default view, the current view is shown in the default view.
- Own view — If you select the Own view, the current view is shown as you have defined it to be shown. For example, the column order can differ from the Default view. For more information, see section Saving Your Own View.
- Print view — If you select the Print view, the current view is shown as you have defined it to be shown for printing or exporting purposes. For example, the column order can differ from the Default view. For more information, see section Saving the Print View.
Note: The contents of the Views area may change according to the selected function. For example, when you browse floor plans, the Views area lists the floors plans in the system. Some grids have no view area. -
Status bar — The Status bar shows information on the system status as follows.
- Server connection status — The Server connection status is either On or Off. In the example figure, the server connection is On.
- Active locking system — The Active locking system indicates the locking system where you are logged in.
-
Status icons — The status icons are, from left to right:
-
 — For more information on the bus status,
click the bus icon. The color codes are:
— For more information on the bus status,
click the bus icon. The color codes are:- Green — The bus data is available.
- Grey — The bus data is not available. the Programmer is disconnected from the computer.
-
 — The connection status icon
indicates if the connection between the computer and the Programmer is functioning or not. The color codes
are:
— The connection status icon
indicates if the connection between the computer and the Programmer is functioning or not. The color codes
are:- Green — The connection is OK.
- Grey — The connection is not OK.
-
 — The first icon indicates the
status of the token on the Programmer. The color
codes are:
— The first icon indicates the
status of the token on the Programmer. The color
codes are:- Green — A token that belongs to the system is inserted.
- Red — A foreign token that belongs to another system is inserted.
- Blue — An empty token is inserted.
-
The second icon indicates the status of the key on the Programmer. The color codes are:
- Blue — The inserted key is empty. The key can be programmed to this system.
- Red — The key belongs to another locking system and cannot be used in this locking system.
- Green — A key programmed in this system is inserted.
-